Skip to content
Build better, together
Displaying Excel Graphs in Microsoft SharePoint

Displaying Excel Graphs in Microsoft SharePoint

Displaying Excel Graphs in Microsoft SharePoint

In SharePoint, I want to show graphs that I have created in Excel. How do I do that?

First you should upload the Excel file to a document library on the same site. Then on the page where you want the graph to be displayed, add a Web part that is the Excel Web Access.

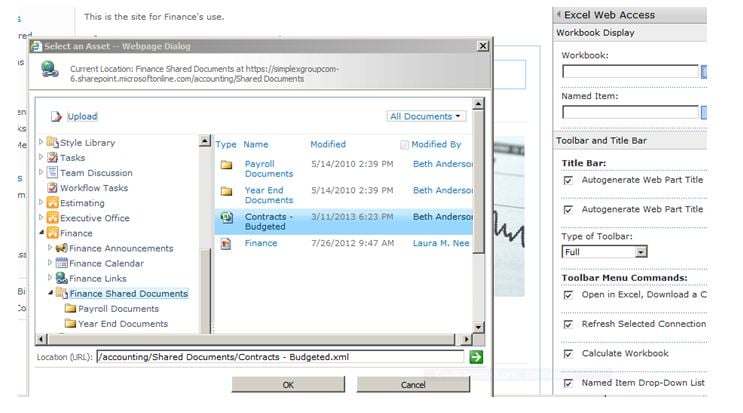
This is found under More Web Parts under the Insert tab, and is within the Business Category. In the Tool Pane for the Web part, select the spreadsheet URL.

beth blog


About VPO

VPO is a cloud-based collaboration platform built just for construction project teams. Easily configurable and user-friendly, VPO is designed to enhance efficiency and productivity while minimizing risk. We partner with each customer to meet their team's unique project management needs. VPO is a certified Woman-owned Business Enterprise (WBE), and we've been improving construction project management through tech since 1984. In a world of start-ups, we're a stay-up.

VPO™

See VPO’s Versatility in Action

Watch a three-minute demo of our construction management software to witness what VPO can do for you.

VPO-inset-laptop-features-min